
Calgary Real Estate Market Update – February 2025
The Calgary real estate market continues to shift as inventory levels rise and sales activity moderates. Despite a decline in year-over-year sales, overall activity remains above long-term trends, and home prices are stabilizing across various property types.
Here’s a closer look at the latest market trends for February 2025.
Sales and Inventory Trends
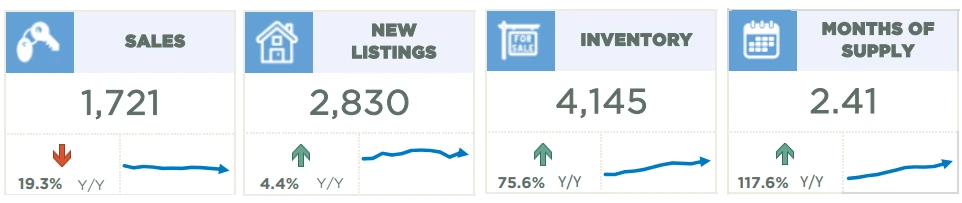
- Sales: 1,721 homes sold in February, a 19% decrease from last year. While sales remain above historical averages, they are well below the record-breaking levels seen during the post-pandemic period.
- New Listings: 2,830 new listings hit the market, reflecting a modest 4% increase year-over-year. This is in line with historical trends but lower than the growth in inventory.
- Inventory: The number of available homes rose significantly, reaching 4,145 units, a 76% increase from 2024.
- Months of Supply: Sitting at 2.41 months, supply levels have more than doubled compared to last year, signaling a shift toward more balanced conditions.
Expert Insight:
“Even though more homes are being listed, sales have slowed, meaning the strong seller’s market of the past few years is easing,” said Alan Tennant, President and CEO of CREB®. “This is giving buyers more opportunities, while also slowing the pace of price increases.”
Home Prices Stabilizing
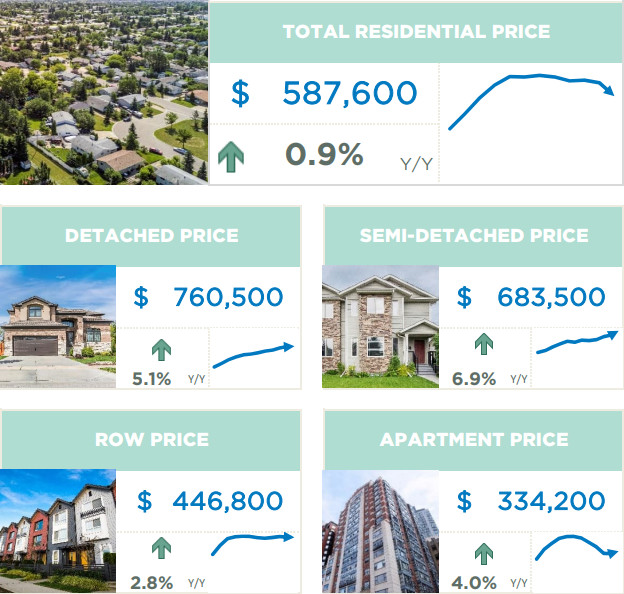
- The total residential benchmark price for Calgary in February was $587,600, up 1% year-over-year but relatively unchanged compared to late 2024.
- Detached homes: $760,500 (+5% Y/Y)
- Semi-detached homes: $683,500 (+7% Y/Y)
- Row/townhouses: $446,800 (+3% Y/Y)
- Apartments: $334,200 (+4% Y/Y)
While prices continue to increase slightly, the rate of growth has slowed due to rising inventory levels.
Property Type Breakdown
🏠 Detached Homes
- Sales: 765 (-20% Y/Y)
- New Listings: 1,265 (+6% Y/Y)
- Inventory: 1,698 (+61% Y/Y)
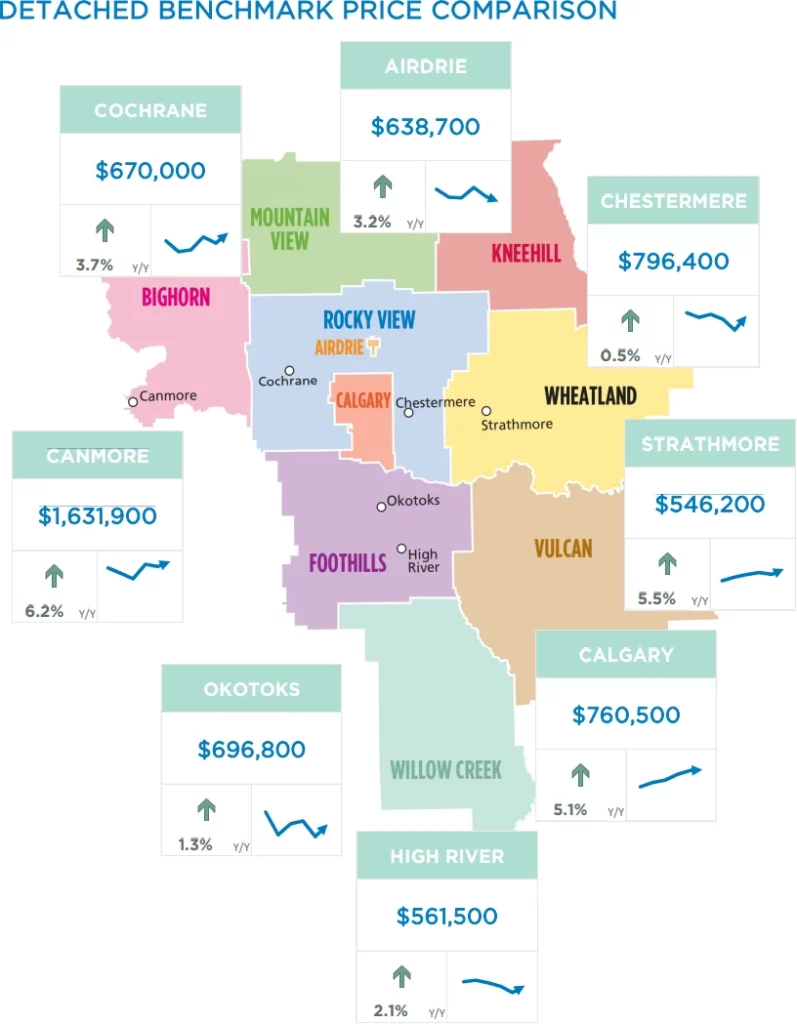
- Benchmark Price: $760,500 (+5% Y/Y)
- Months of Supply: 2.22
Detached home sales have declined as more listings enter the market. While prices are still rising, the pace has slowed, giving buyers more negotiating power in some areas.
🏘️ Semi-Detached Homes
- Sales: 165 (-14% Y/Y)
- New Listings: 240 (+7% Y/Y)
- Inventory: 326 (+46% Y/Y)
- Benchmark Price: $683,500 (+7% Y/Y)
- Months of Supply: 1.98
Despite a drop in sales, semi-detached homes remain in demand, with inventory levels still below long-term averages. The highest price growth was seen in the City Centre and South districts, at nearly 8% year-over-year.
🏡 Row/Townhouses
- Sales: 318 (-9% Y/Y)
- New Listings: 473 (+4% Y/Y)
- Inventory: 655 (+113% Y/Y)
- Benchmark Price: $446,800 (+3% Y/Y)
- Months of Supply: 2.06
Row/townhouses are experiencing a surge in inventory, with levels more than double what they were last year. While prices are still increasing, some districts—especially the East district—saw notable gains of over 12% Y/Y.
🏢 Apartment Condos
- Sales: 473 (-26% Y/Y)
- New Listings: 852 (+2% Y/Y)
- Inventory: 1,466 (+90% Y/Y)
- Benchmark Price: $334,200 (+4% Y/Y)
- Months of Supply: 3.10
Apartments continue to see high inventory levels, with months of supply increasing significantly. However, this sector still remains one of the more affordable options, drawing interest from first-time buyers and investors.
District Price Trends
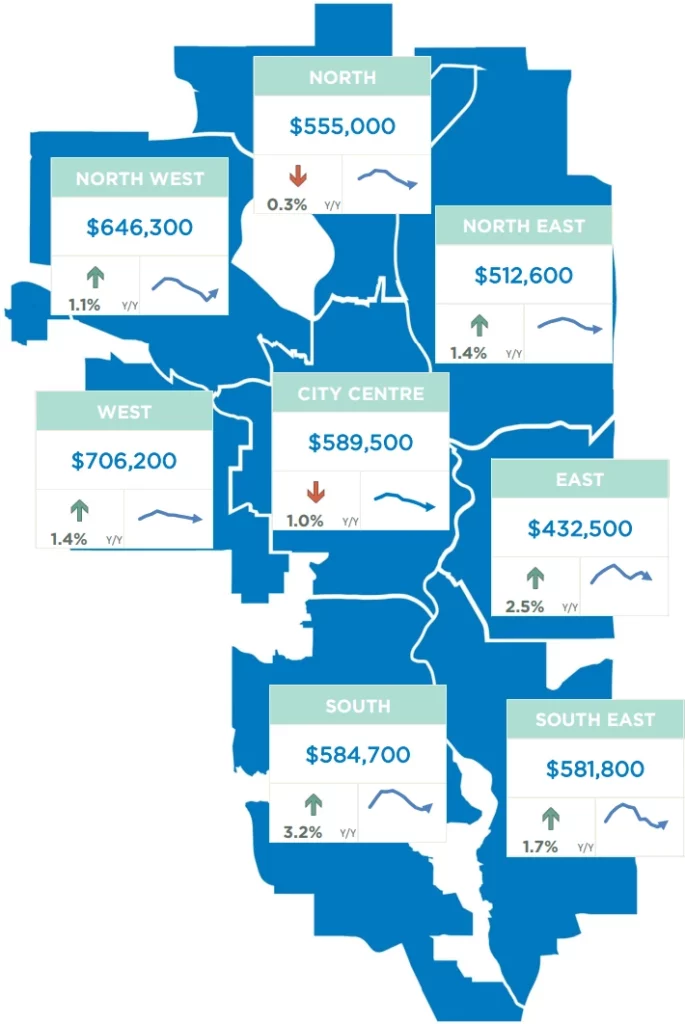
Benchmark prices saw varied movements across Calgary’s districts:
- City Centre: $589,500 (+0.3% Y/Y)
- North: $555,000 (+1.0% Y/Y)
- Northeast: $512,600 (+1.4% Y/Y)
- Northwest: $646,300 (+1.1% Y/Y)
- West: $706,200 (+1.4% Y/Y)
- East: $432,500 (+3.2% Y/Y) – highest growth
- South: $584,700 (+1.7% Y/Y)
- Southeast: $581,800 (+2.5% Y/Y)
While most areas saw modest price growth, the East district led the way with a 3.2% increase, while the City Centre remained relatively flat.
Regional Real Estate Market Update – February 2025
While inventory levels improved in many regional markets, overall supply remains tight, and strong demand continues to support price growth.
Airdrie Market Update
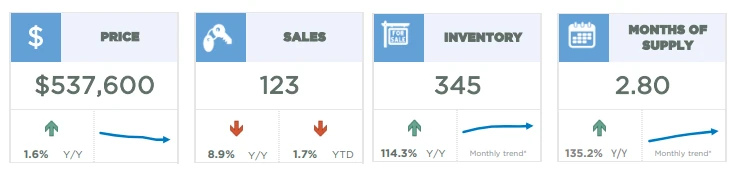
- Sales: 123 (-8.9% Y/Y)
- New Listings: 225 (+22.9% Y/Y)
- Inventory: 345 (+114.3% Y/Y)
- Months of Supply: 2.80
- Benchmark Price: $537,600 (+1.6% Y/Y)
Airdrie’s market followed long-term seasonal trends in February. Sales declined by nearly 9%, while new listings increased by 23%, pushing inventory levels up significantly compared to last year. This increase in supply helped months of inventory rise to 2.8 months, the highest level seen since before the pandemic. Prices remained relatively stable, up slightly from February 2024.
Cochrane Market Update
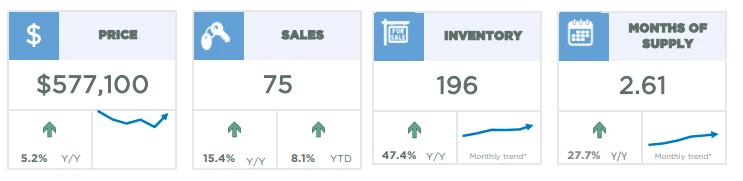
- Sales: 75 (+15.4% Y/Y)
- New Listings: 126 (+8.1% Y/Y)
- Inventory: 196 (+47.4% Y/Y)
- Months of Supply: 2.61
- Benchmark Price: $577,100 (+5.2% Y/Y)
Cochrane saw stronger sales activity in February, increasing over 15% year-over-year, while new listings also rose. Inventory levels showed significant recovery, reaching their highest level since early 2021. However, supply remains below long-term averages, keeping market conditions relatively tight. Benchmark prices rose by over 5% annually, nearing record highs.
Okotoks Market Update
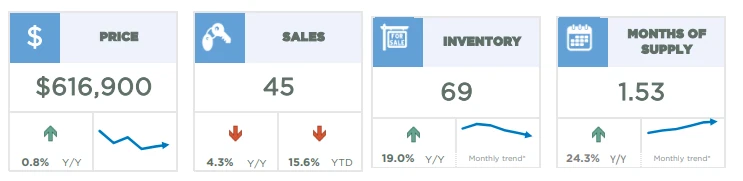
- Sales: 45 (-4.3% Y/Y)
- New Listings: 60 (+7% Y/Y)
- Inventory: 69 (+19% Y/Y)
- Months of Supply: 1.53
- Benchmark Price: $616,900 (+0.8% Y/Y)
Sales in Okotoks declined slightly in February, while new listings saw a modest increase. Inventory levels improved but remained low compared to historical norms, keeping the months of supply under 2 months. Prices held steady, showing a small increase from last year.
Other Regional Real Estate Market Highlights
- Chestermere: 47 sales (+24.3% Y/Y), $697,300 benchmark price (+5.5% Y/Y)
- Rocky View Region: 122 sales (+27.7% Y/Y), $649,300 benchmark price (+2% Y/Y)
- Foothills Region: 86 sales (+2% Y/Y), $639,700 benchmark price (+1% Y/Y)
- Mountain View Region: 41 sales (+5% Y/Y), $485,400 benchmark price (+3% Y/Y)
- Bighorn Region: 33 sales, $1,074,600 benchmark price (+6.2% Y/Y)
Key Takeaways
The Calgary market remains competitive, with homes selling quickly in many areas. Surrounding regions like Airdrie, Cochrane, and Chestermere are also seeing strong activity, despite some inventory relief.
As we move further into 2025, buyers and sellers should stay informed about evolving market conditions. If you’re considering buying or selling, working with a real estate professional can help you navigate this dynamic market.
Stay tuned for the latest market updates and consult with a local expert from Maverick Group to help you navigate the 2025 real estate environment!
Sources